Getting Started
If this is first time using Ellipsis or dont know how to convert your existing tif files into geotiff (required file format in Ellipsis), visit our Getting Started Guide For setup instructions.
For more information about API's click here
API's are public for testing purposes. Authentication and Authorization is not activated yet. They will be implemented after platform development.
Understanding the disease_detection Endpoint
Geographic Coordinates
When using the disease_detection endpoint, you need to provide geographic coordinates that define the area you want to analyze. Here's what each term means:
access_token: This is your personal authorization token to gain access for ELLIPSISraster_pathId: A unique identifier representing the path to the base raster file of the spectral band within Ellipsis.-
destination_pathId: Desired destionation folder's path id to be upload response geojson. -
lat_min: The minimum latitude of your area of interest. lat_max: The maximum latitude of your area of interest.lon_min: The minimum longitude of your area of interest.lon_max: The maximum longitude of your area of interest.
These coordinates create a bounding box on the earth's surface, targeting the region for which you want the disease detection to be performed.
Acces Token
Access Token is required for reaching and uploading data from Ellipsis Drive. Below is an example of Python code demonstrating how to easily obtain your access token.
import ellipsis as el
access_token = el.account.logIn("ELLIPSIS_USERNAME", "ELLIPSIS_PASSWORD")
print(access_token)
More information can be accessed through this LINK
Time Series Data
The API is designed to analyze time series data, which means it looks at changes over time. For this endpoint, your data must include exactly four timestamps.
-
timestamp: The date when the satellite image was taken, formatted as "YYYY-MM-DD" e.g. "1923-10-29" as a string. -
timestampId: A unique identifier representing the timestamp id to the timestamp of the spectral bands within Ellipsis.
Each timestamp and timestampId must be accompanied by five different types of spectral bands.
Spectral Bands
Spectral bands are specific wavelengths of light that the satellite sensor can capture. Each band provides different information about what's on the ground. For disease_detection, you need to include five distinct band types for each timestamp:
- Red
- Blue
- Green
- RE (Red Edge)
- NIR (Near-Infrared)
File ID
In the disease_detection data payload, each spectral band image is identified with an fileId. This is a unique identifier which points to the location of the TIF file for the respective band in the Ellipsis platform.
fileId: A unique identifier representing the path to the TIF file of the spectral band within Ellipsis.
Ensure that each fileId you provide corresponds to the correct band for each timestamp in your dataset.
Example payload
{
    "access_token": "ELLIPSIS_TOKEN",
    "raster_pathId": "RASTER_PATH_ID",
    "destination_pathId": "DESTINATION_PATH_ID",
    "lat_min": MIN_LAT_FLOAT,
    "lat_max": MAX_LAT_FLOAT,
    "lon_min": MIN_LON_FLOAT,
    "lon_max": MAX_LON_FLOAT,
    "data": [
    {
        "timestamp": "2023-06-01",
        "timestampId": "TIMESTAMP_ID",
        "bands": [
        {
            "fileId": "RED_BAND_FILE_ID",
            "band_info": "Red"
        },
        {
            "fileId": "GREEN_BAND_FILE_ID",
            "band_info": "Green"
        },
        {
            "fileId": "BLUE_BAND_FILE_ID",
            "band_info": "Blue"
        },
        {
            "fileId": "RE_BAND_FILE_ID",
            "band_info": "RE"
        },
        {
            "fileId": "NIR_BAND_FILE_ID",
            "band_info": "NIR"
        }
        ]
    },
    {
        "timestamp": "2023-07-20",
        "timestampId": "TIMESTAMP_ID",
        "bands": [
        {
            "fileId": "RED_BAND_FILE_ID",
            "band_info": "Red"
        },
        {
            "fileId": "GREEN_BAND_FILE_ID",
            "band_info": "Green"
        },
        {
            "fileId": "BLUE_BAND_FILE_ID",
            "band_info": "Blue"
        },
        {
            "fileId": "RE_BAND_FILE_ID",
            "band_info": "RE"
        },
        {
            "fileId": "NIR_BAND_FILE_ID",
            "band_info": "NIR"
        }
        ]
    },
    {
        "timestamp": "2023-08-04",
        "timestampId": "TIMESTAMP_ID",
        "bands": [
        {
            "fileId": "RED_BAND_FILE_ID",
            "band_info": "Red"
        },
        {
            "fileId": "GREEN_BAND_FILE_ID",
            "band_info": "Green"
        },
        {
            "fileId": "BLUE_BAND_FILE_ID",
            "band_info": "Blue"
        },
        {
            "fileId": "RE_BAND_FILE_ID",
            "band_info": "RE"
        },
        {
            "fileId": "NIR_BAND_FILE_ID",
            "band_info": "NIR"
        }
        ]
    },
    {
        "timestamp": "2023-08-20",
        "timestampId": "TIMESTAMP_ID",
        "bands": [
        {
            "fileId": "RED_BAND_FILE_ID",
            "band_info": "Red"
        },
        {
            "fileId": "GREEN_BAND_FILE_ID",
            "band_info": "Green"
        },
        {
            "fileId": "BLUE_BAND_FILE_ID",
            "band_info": "Blue"
        },
        {
            "fileId": "RE_BAND_FILE_ID",
            "band_info": "RE"
        },
        {
            "fileId": "NIR_BAND_FILE_ID",
            "band_info": "NIR"
        }
        ]
    }
    ]
}
you can try disease_detection API by simply replacing <ELLIPSIS_TOKEN> with your existing token and <DESTINATION_PATH_ID> with the desired destionation path ID on Ellipsis drive. Then, copy and paste the example payload to the API to upload the response GeoJSON."
⚠️ Attention! current alpha version of the model requires exactly 4 different time stamps with 5 band inside each of them.
for band_info use "Red" , "Blue" , "Green" , "RE" or "NIR"
By supplying this structured data, the disease_detection API can process your time series of satellite images and analyze the selected area for signs of plant disease.
example request via curl for disease_detection
Understanding the disease_detection_raster Endpoint
The disease_detection_raster endpoint uses the same payload as the disease_detection endpoint. However, the disease_detection_raster endpoint generates a raster response instead of a GeoJSON response. For more details, check the Understanding the Raster Results section and the Understanding the Ellipsis Vector Layer Results section.
Example payload
{
    "access_token": "ELLIPSIS_TOKEN",
    "raster_pathId": "RASTER_PATH_ID",
    "destination_pathId": "DESTINATION_PATH_ID",
    "lat_min": MIN_LAT_FLOAT,
    "lat_max": MAX_LAT_FLOAT,
    "lon_min": MIN_LON_FLOAT,
    "lon_max": MAX_LON_FLOAT,
    "data": [
    {
        "timestamp": "2023-06-01",
        "timestampId": "TIMESTAMP_ID",
        "bands": [
        {
            "fileId": "RED_BAND_FILE_ID",
            "band_info": "Red"
        },
        {
            "fileId": "GREEN_BAND_FILE_ID",
            "band_info": "Green"
        },
        {
            "fileId": "BLUE_BAND_FILE_ID",
            "band_info": "Blue"
        },
        {
            "fileId": "RE_BAND_FILE_ID",
            "band_info": "RE"
        },
        {
            "fileId": "NIR_BAND_FILE_ID",
            "band_info": "NIR"
        }
        ]
    },
    {
        "timestamp": "2023-07-20",
        "timestampId": "TIMESTAMP_ID",
        "bands": [
        {
            "fileId": "RED_BAND_FILE_ID",
            "band_info": "Red"
        },
        {
            "fileId": "GREEN_BAND_FILE_ID",
            "band_info": "Green"
        },
        {
            "fileId": "BLUE_BAND_FILE_ID",
            "band_info": "Blue"
        },
        {
            "fileId": "RE_BAND_FILE_ID",
            "band_info": "RE"
        },
        {
            "fileId": "NIR_BAND_FILE_ID",
            "band_info": "NIR"
        }
        ]
    },
    {
        "timestamp": "2023-08-04",
        "timestampId": "TIMESTAMP_ID",
        "bands": [
        {
            "fileId": "RED_BAND_FILE_ID",
            "band_info": "Red"
        },
        {
            "fileId": "GREEN_BAND_FILE_ID",
            "band_info": "Green"
        },
        {
            "fileId": "BLUE_BAND_FILE_ID",
            "band_info": "Blue"
        },
        {
            "fileId": "RE_BAND_FILE_ID",
            "band_info": "RE"
        },
        {
            "fileId": "NIR_BAND_FILE_ID",
            "band_info": "NIR"
        }
        ]
    },
    {
        "timestamp": "2023-08-20",
        "timestampId": "TIMESTAMP_ID",
        "bands": [
        {
            "fileId": "RED_BAND_FILE_ID",
            "band_info": "Red"
        },
        {
            "fileId": "GREEN_BAND_FILE_ID",
            "band_info": "Green"
        },
        {
            "fileId": "BLUE_BAND_FILE_ID",
            "band_info": "Blue"
        },
        {
            "fileId": "RE_BAND_FILE_ID",
            "band_info": "RE"
        },
        {
            "fileId": "NIR_BAND_FILE_ID",
            "band_info": "NIR"
        }
        ]
    }
    ]
}
you can try disease_detection API by simply replacing <ELLIPSIS_TOKEN> with your existing token and <DESIRED_DESTINATION_PATH_ID> with desired destionation path id on ellipsis Drive to upload the response raster, and copy and paste the example payload to the API.
By supplying this structured data, the disease_detection_raster API can process your time series of satellite images and analyze the selected area for signs of plant disease.
example request via curl for disease_detection_raster
Checking the Status of Your Disease Detection Request
After submitting your request to the disease_detection endpoint, you will receive both a task_id and a path_id. While the task_id helps track the status of your request, the path_id allows you to access the results directly within the Ellipsis platform. Here's what you need to know:
Path ID
- This identifier is provided along with the status update and allows you to view the vector layer results in Ellipsis. This means you can directly see and analyze the affected areas mapped out in the application.
Task ID
- The
task_idis a unique identifier for your disease detection request. You'll get this ID as a response from thedisease_detectionendpoint after a successful submission.task_idis also the file name in ellipsis.
Possible Status Responses
When you query the status endpoint, you can receive one of four outcomes:
completed: Your request has been successfully processed, and the results are ready.processing: Your request is still being processed. Check back after some time.interaction_required: There's an issue with Access token or the input data. This means one or more fields are missing, or a provided link is incorrect.error: There's an internal problem with the disease detection system.Downloading: Files necessary for your task are being downloaded.Uploading: Your results are currently being uploaded to the ellipsis.TaskId Not Found: The task ID provided does not exist in the system.
Interpreting the Status
- If you receive a
completedstatus, you can move on to retrieving your results. Vector GeoJSON response with the analysis results will be attached to the status update for convenience. - A
processingstatus indicates that the system is still analyzing your data. - If you encounter
interaction_required, you need to review and correct your input data. - An
errorstatus means there is a problem on the system's side, and it may be necessary to contact support or try your request again later. Downloadingstatus indicates file downloads still continues and process is not started yet.Uploadingstatus indicates process is finished and necesery files uploading to ellipsis.- If you receive a
TaskId Not Foundgiven task ID is not exist. check task ID in Disease Detection and try again.
By following the status of your request, you can understand where it is in the processing pipeline and take action accordingly.
Once your disease_detection task has been completed, the results will be accessible through the Ellipsis platform. You will need to provide the path_id you received from the get_result endpoint. If the status is completed, the get_result endpoint will return a path_id to analyze results in ellipsis platform.
example request via curl for get_result
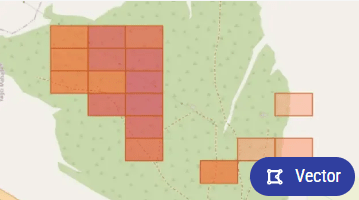
Retrieving Results
After the completion of your disease_detection task, the results will be visualized in the Ellipsis platform as distinct vector layers. Each colored box on the map represents a vector layer correlating to a specific area of your field. For disease_detection_raster, results are shown as raster images with color gradients from green to red, indicating disease severity. These visualizations help in identifying areas needing attention, allowing for targeted interventions and better crop management.
Understanding the Ellipsis Vector Layer Results
✨ Note: This is a result from a legacy model. For more precise and detailed analysis, we recommend using the advanced segmentation model below.
Ellipsis utilizes vector layers to visually represent the findings of our disease_detection service. These layers illustrate the geographical distribution and severity of plant diseases within your fields.
Vector Layers
- Each vector layer is color-coded to indicate the level of concern for disease presence.
- Darker colors denote areas with higher levels of detected plant disease, signaling a greater need for attention.
- Lighter colors suggest lower levels of concern.
⚠️ Attention! current alpha version of the model does not support colored layers.
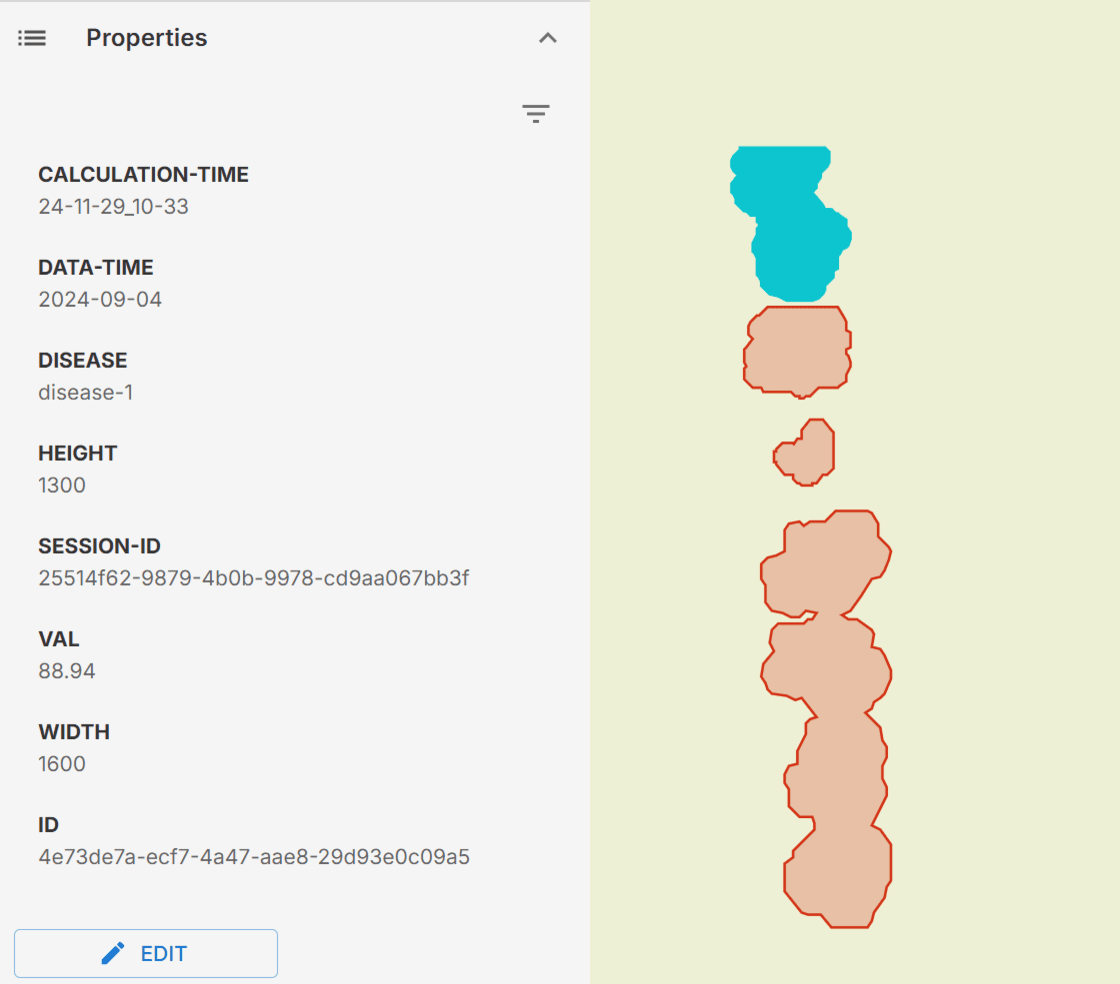
Another key metric within these results is denoted as val. This value serves as an indicator of crop health, quantifying the intensity of the disease impact within a particular area. Higher the value, the greater the level of disease and the need for potential intervention. Colors in the vector map decided by this value. So red or darker areas are closer to 100 while green or lighter areas are closer to 0
When you explore the vector layers in Ellipsis, selecting a layer will reveal its Properties, providing detailed information and metrics associated with that specific area and calculations:
-
calculation-time: When the analysis was completed. -
data-time: The last date of the satellite imagery used. -
disease: The type of disease detected. -
width and height: The dimensions of the satellite image. -
session-id: A unique identifier for your analysis session. -
val: The value indicating the severity of the detected disease on a scale.
(100 represents significant changes over time with a high potential for disease, while 0 represents minimal changes with low disease risk).
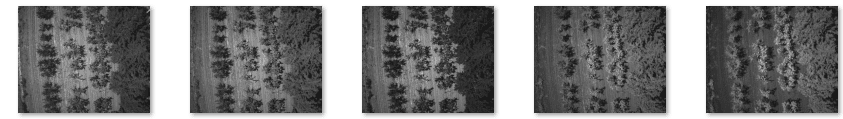
Understanding the Raster Results
✨ Note: This is a result from a legacy model. For more precise and detailed analysis, we recommend using the advanced segmentation model below.
The disease_detection_raster endpoint produces raster outputs that visually depict the disease presence in your fields. These raster images represent the severity and distribution of plant diseases, with color gradients indicating various levels of potential disease impact.
Raster Visualization
Color Coding: The raster images use green, yellow, orange, and red to illustrate disease severity.
-
Green: Indicates healthy areas with minimal changes. -
Yellow: Suggests slight changes that might lead to sickness in the future. -
Orange: Represents areas starting to show changes, indicating potential disease. -
Red: Denotes significant changes and requires immediate attention.
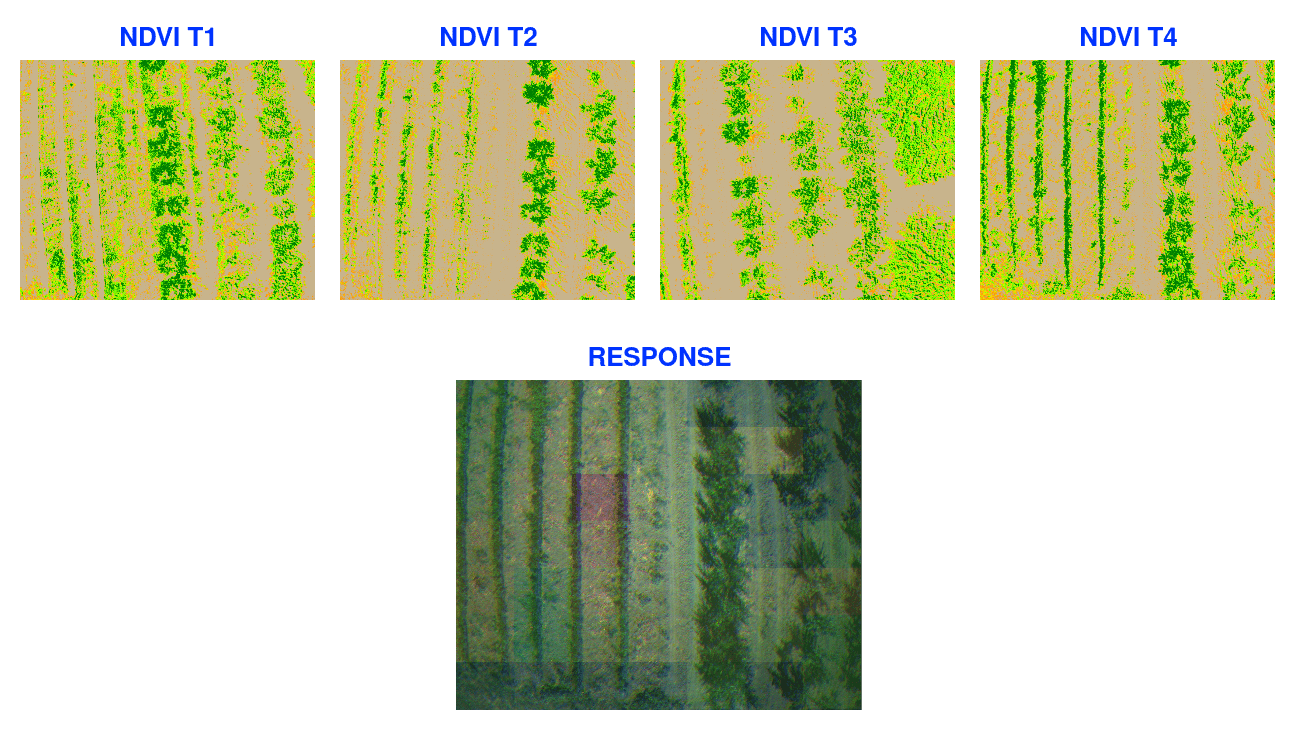
In the above image:
-
NDVI T1 to T4: These represent the Normalized Difference Vegetation Index (NDVI) for four different timestamps. NDVI is being used just to show rendering of visual data, the internal processing use custom model to detect health status off the area.
-
Response: This image shows the combined analysis, indicating areas of concern.
Raster response helps about understand crop health and identify areas needing attention.
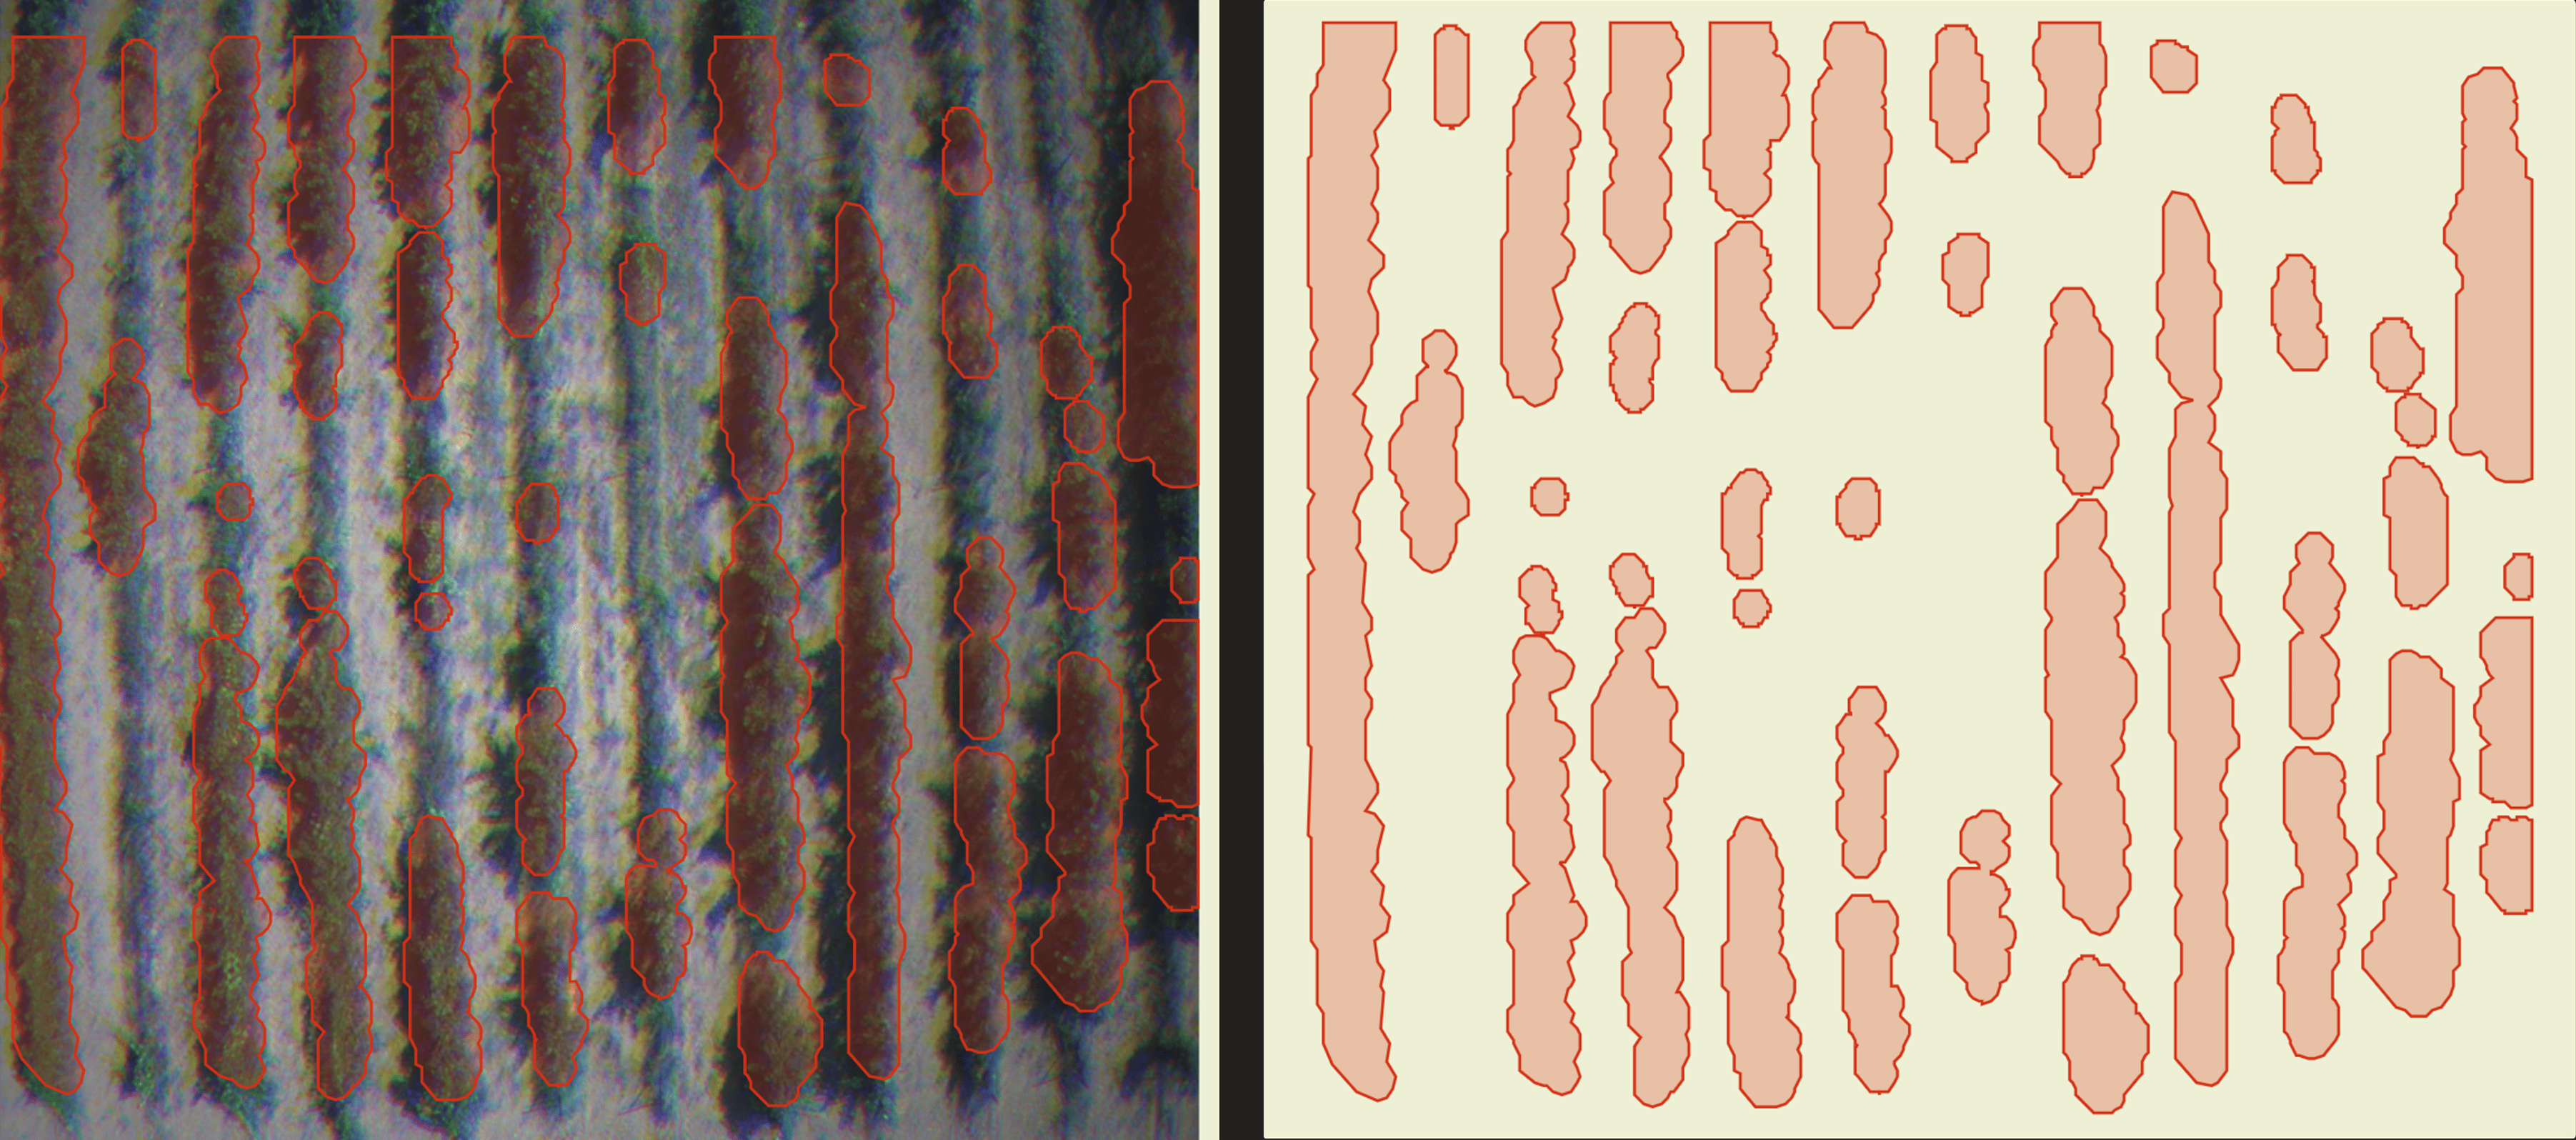
Understanding the Disease Segmentation Results
The Disease Segmentation model is our most advanced disease detection method, providing highly detailed insights into affected areas. Unlike the traditional vector or raster outputs, which offer an overview of disease presence, the segmentation results offer near pixel-level precision, enabling you to pinpoint exact areas of concern within your fields.
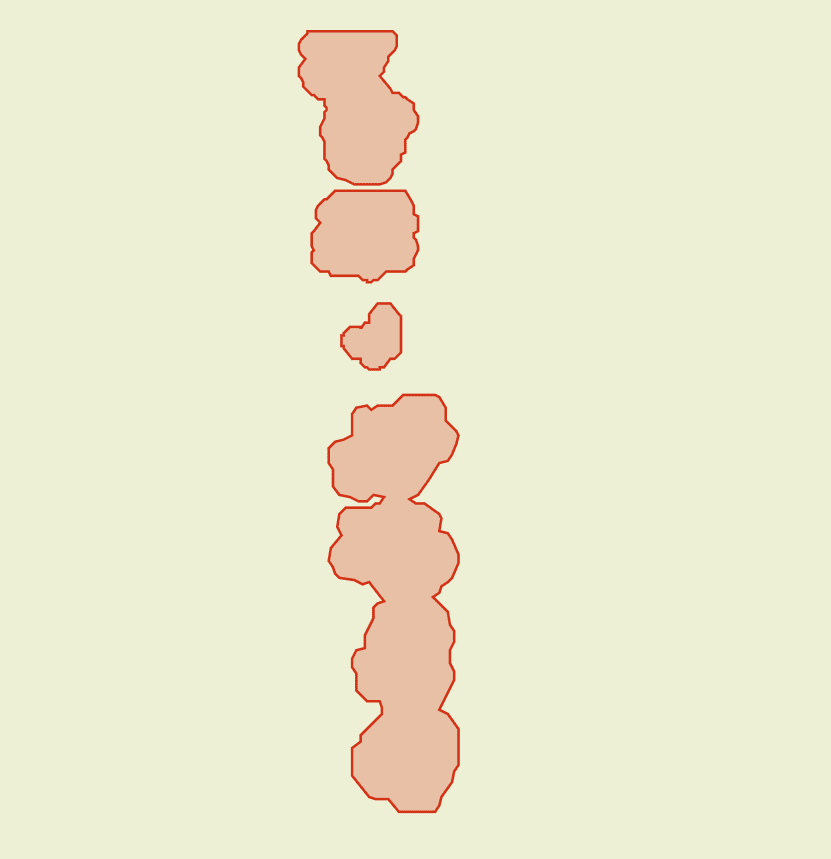
By clicking on the desired detection area, you can access detailed information about that specific region. The most critical metric displayed is the val, which indicates crop health by quantifying the intensity of disease impact in the area. A higher val signifies a greater level of disease severity and highlights the need for potential intervention.
Understanding the Disease Segmentation raster Results
Our Disease Segmentation raster endpoint helps to better visualize and understand how the segmentation vectors align with actual field data. By overlaying the segmentation vector results onto the raster images, you can see a clear comparison of the detected areas of concern against the real-world imagery.
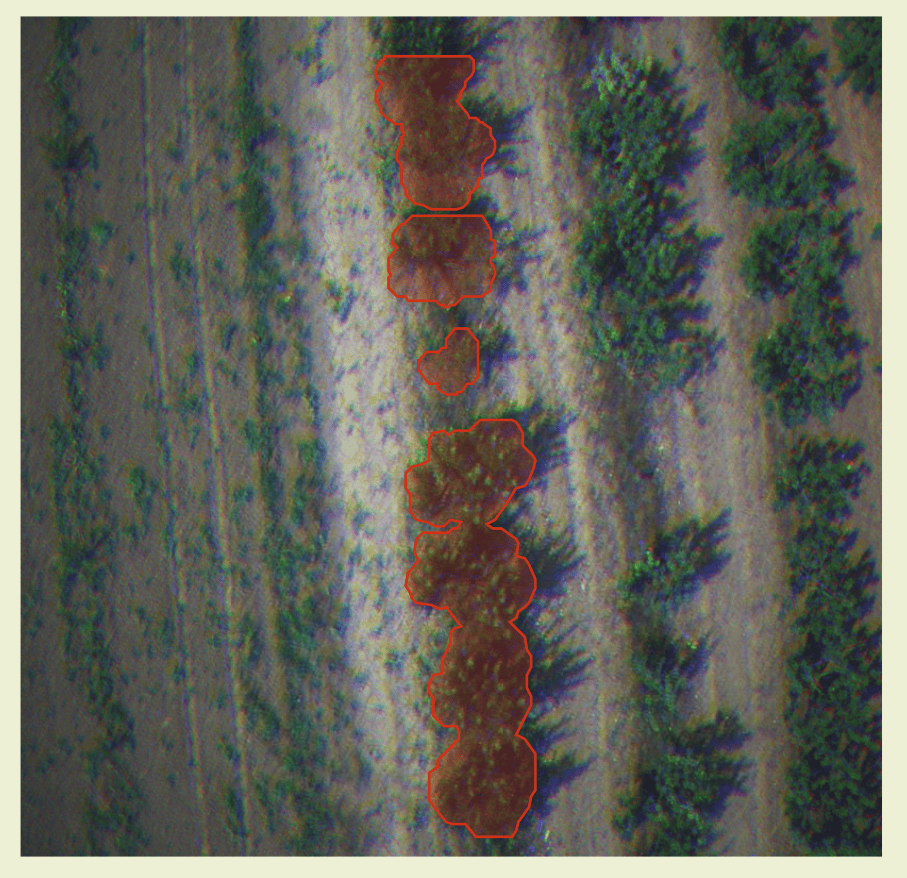 To view above result, you need to enable both the
 Disease Segmentation and Disease Segmentation raster layers in Ellipsis.
GRAPE Model for Disease Segmentation
The GRAPE Disease Segmentation model is a specialized version of our advanced segmentation model, designed specifically for detecting diseases in grape crops. This model provides highly detailed insights into affected areas, similar to the Apple segmentation model, but optimized for grapevine fields. It ensures precise disease detection and mapping, allowing for near pixel-level accuracy and targeted intervention in vineyards.
Grape model use exact same payload structure with Apple model, so examples and tutorials in document is valid for both models. Only difference is you need to choose Disease Segmentation and Disease Segmentation raster under GRAPE MODEL section in API